How Scrum Teams Can Seek Out and Destroy Organizational Impediments and Unplanned Work
A team should be able to complete 80–110% of their planned stories each and every sprint without heroics.
Why is this important?
- The work output from this team is predictable. When the team commits to a set of stories at the beginning of the sprint, other teams can rely on them to deliver.
- Predictable output breeds confidence. If a team consistently delivers on their commitments, they are considerably more credible when they need to push back on unrealistic expectations.
- The team will likely feel motivated because they’ve demonstrated a degree of mastery in their craft.
- The team has a stable base. Because they are delivering on their expectations, they can focus their energy on continuous improvement and optimization.
If a team regularly completes less than 80% of their sprint objectives, why does this happen?
- The work tasks do not meet INVEST criteria and thus cannot be estimated accurately.
- New work is given to the team mid-sprint.
- The team faces new and old impediments that interfere—usually unpredictably—with their ability to deliver the work.
It’s not always easy to glean these issues from tools like Rally. Thankfully, there’s a simple solution that can help both individual teams and the program discover the severity and nature of the issues that prevent a team from achieving fast, flexible flow.
The Status Quo
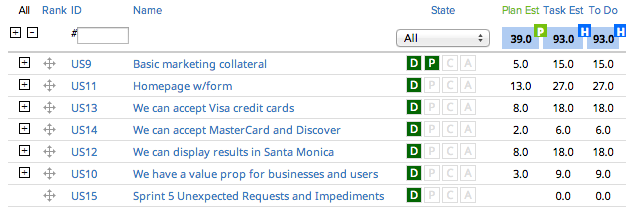
Let’s take the example of a 2-person team working a 2-week sprint. (This isn’t an ideal team setup, but it keeps the numbers easier to work with.) Here’s their sprint backlog a few hours after planning:
They’ve taken on 39 story points, which is one fewer than the 40 accepted story points they completed last sprint. That’s perfectly reasonable.
They’ve added tasks to each of these stories and began work on the first one.
I like to assume 6 hours/day of productivity per developer to account for planning meetings, standups, retrospectives, breaks, lunch, etc. Two developers * 2 weeks * 6 hours/day = 120 hours. Assuming a 25% “safety factor” (some teams use 30%, others use 20%, the truth is that we’re splitting hairs at this point), the team should be able to complete about 96 hours of planned tasks this sprint. They’ve identified 93, so this “smells” okay.
(Note: the team should use story points to gauge how much work to accept into the sprint backlog. Use the task hours as a sanity check.)
Let’s fast forward a week and a half. It’s Tuesday afternoon, and there are about 2-1/2 days left in the sprint:
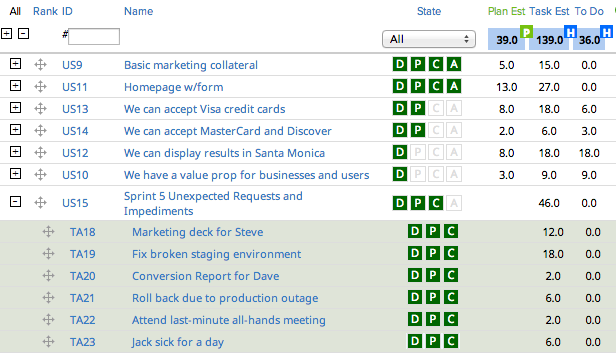
The product owner accepted 18 points or 46% of the sprint. There’s 36 hours of work left and about 30 hours of time left, so we’re a little behind. Most novice Scrum teams would not register concern at this point.
What happened during the sprint? The development team raised impediments during the standup and worked through them. One developer was out sick for a day. The team had to go to an unexpected all-hands meeting, and they had to do a couple of side projects.
The problem is, there’s no measurement or record of these unexpected requests and impediments. The unexpected requests should not have been added mid-sprint unless they were (rare) “on-fire” issues. The team (and anyone who attended the standups) would know what the issues were, but this knowledge is limited or non-existing at the program level or higher.
This is a missed learning opportunity as we do not have the transparency we need to inspect and adapt.
Introducing the Unexpected Requests and Impediments Story
Let’s rewind and add a new story to the sprint backlog:
Note the addition of “Sprint 5 Unexpected Requests and Impediments” at the bottom. This doesn’t get story points and it’s at the bottom because it’s the last thing you want your team to be working on.
Each and every unexpected request or impediment gets added to this story as a task (with hours) during the sprint, like so:
Suddenly these side projects and impediments become real.
Let’s take a look at that mid-sprint view of the backlog again.

Suddenly, the problem becomes even more clear. We should be able to complete about 120 hours of work in a 2-person, 2-week sprint, but our task estimate is now up to 139. Unless this team works overtime (which they should not do as it is demotivating and ultimately productivity-killing), we’re not going to complete all of our stories in time for the demo.
So here’s where this team ended up right before their demo:
They completed 28 story points or 72%. A “pointy-haired boss” might look at this team and say “you failed.”
That statement in and of itself is a failure. It jumps to the conclusion that the team experienced a performance failure. In reality (with all credit due to Mary Poppendieck), the more likely failure is that of the original hypothesis: that the team could have completed the work in the first place. There’s a major missed opportunity: the opportunity to learn something from our system and adapt.
We budgeted 25% of our time for these sorts of issues, or 24 hours. We wound up with 46 hours of unexpected requests and impediments, 22 hours “over budget.” We had 15 hours of work remaining on the two stories we didn’t complete, so it’d be pretty reasonable to say that had it not been for those extra 22 hours of work, we would have completed this sprint (and perhaps even added a 1- or 2-point story).
Ideally, you’re keeping track of your velocity from sprint to sprint. Add another metric: keep track of the percentage of task hours each sprint that came from unexpected requests and impediments.
So what?
Now we have transparency. Transparency allows inspection, inspection allows adaptation. Here are some ways to use this information to inspect and adapt:
- The team can review the impediments and suggest user stories to the product manager (often spikes or technical user stories) to help address some of the underlying technical impediments.
- The team can use this as feedback that they may need to slow down and refactor to address technical debt. They may not want to create new user stories, but they should at least spend a little extra time on their new user stories to clean up old debt and avoid creating new debt.
- The Product Owner can show stakeholders the cost of unexpected requests and impediments on their predictability. This gives them the evidence they need to hold off on new requests until the next sprint and spend more time building quality into the work that they are doing.
- Engineering managers and program managers can review impediments across teams and look for impediment patterns to solve. For instance, an engineering manager may be able to quantify that the company spends 10-15% of their development time fixing broken environments. This data could justify an much-needed investment: “We lose $1M a year in productivity fixing broken environments [based on salaries multiplied by time lost]. A new VM system would reduce this cost by 50% and cost us $100K.”
There you have it. Regardless of the software you use (if any), you can add the Unexpected Requests and Impediments story to your sprint backlog. You can use the data it generates to gain knowledge and take corrective action.
What are your thoughts? Have you used something like this in your own team? Please share your thoughts!
Photo from Kyle Pearson on flickr


