A lineage tree, by the hour
Tibetan refuge-tree paintings put a practitioner’s teachers, and their teachers, row on row around the central figure. The roots are Buddhist, but the painting isn’t devotional so much as a map of where an understanding came from. Last week I wondered what mine would look like drawn from records, with each line as wide as the hours I spent.
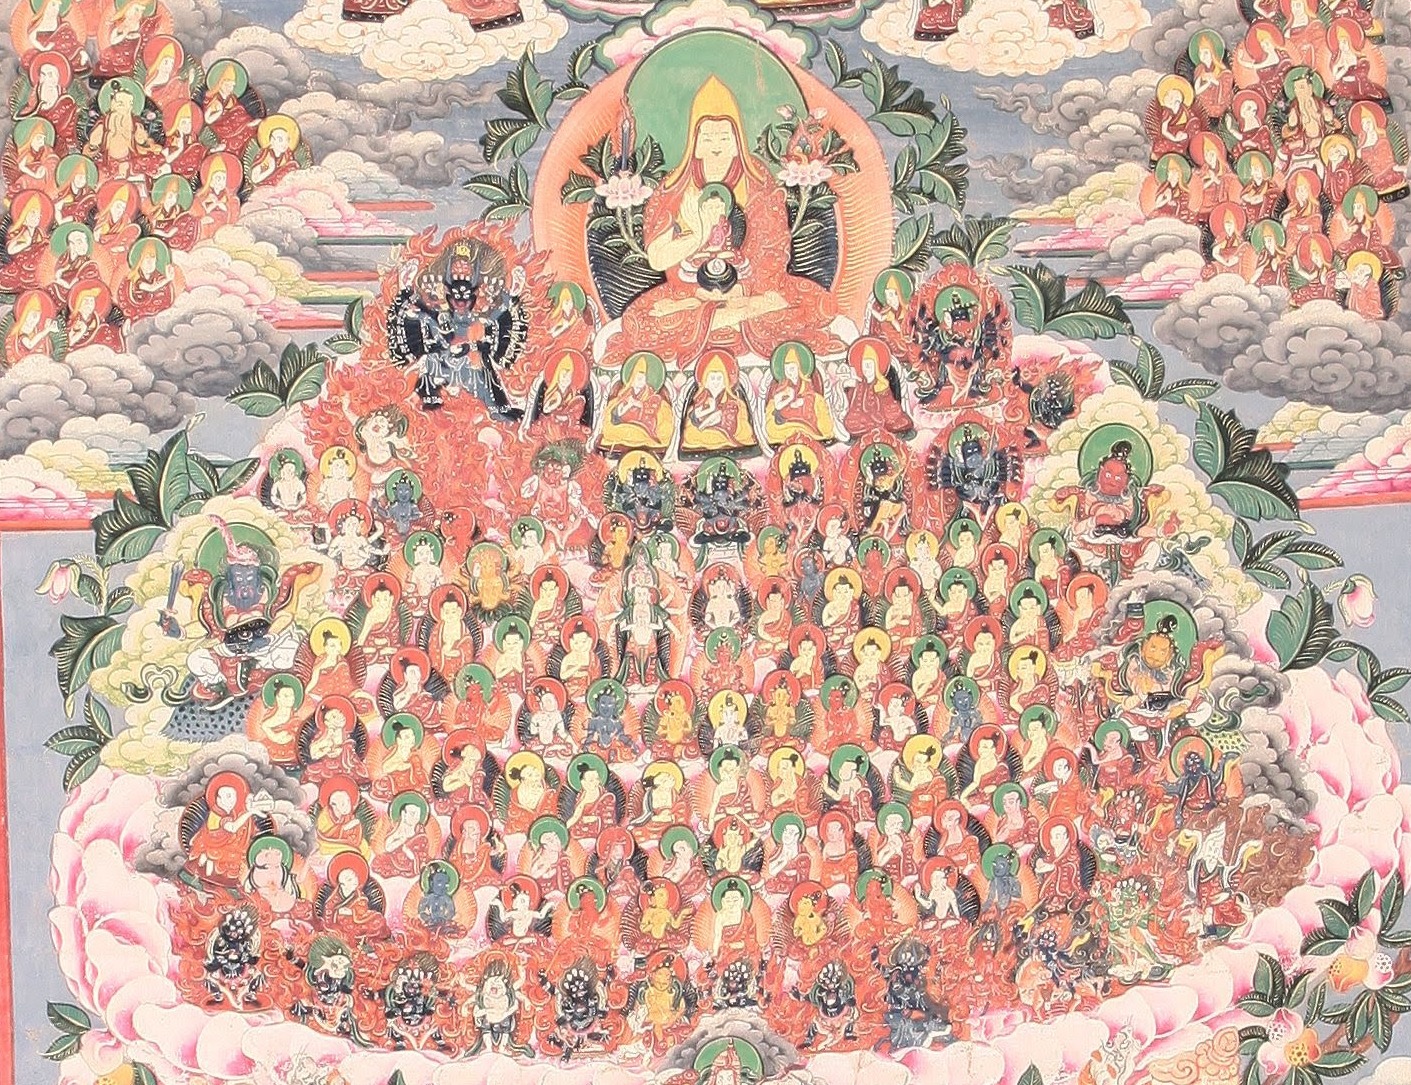
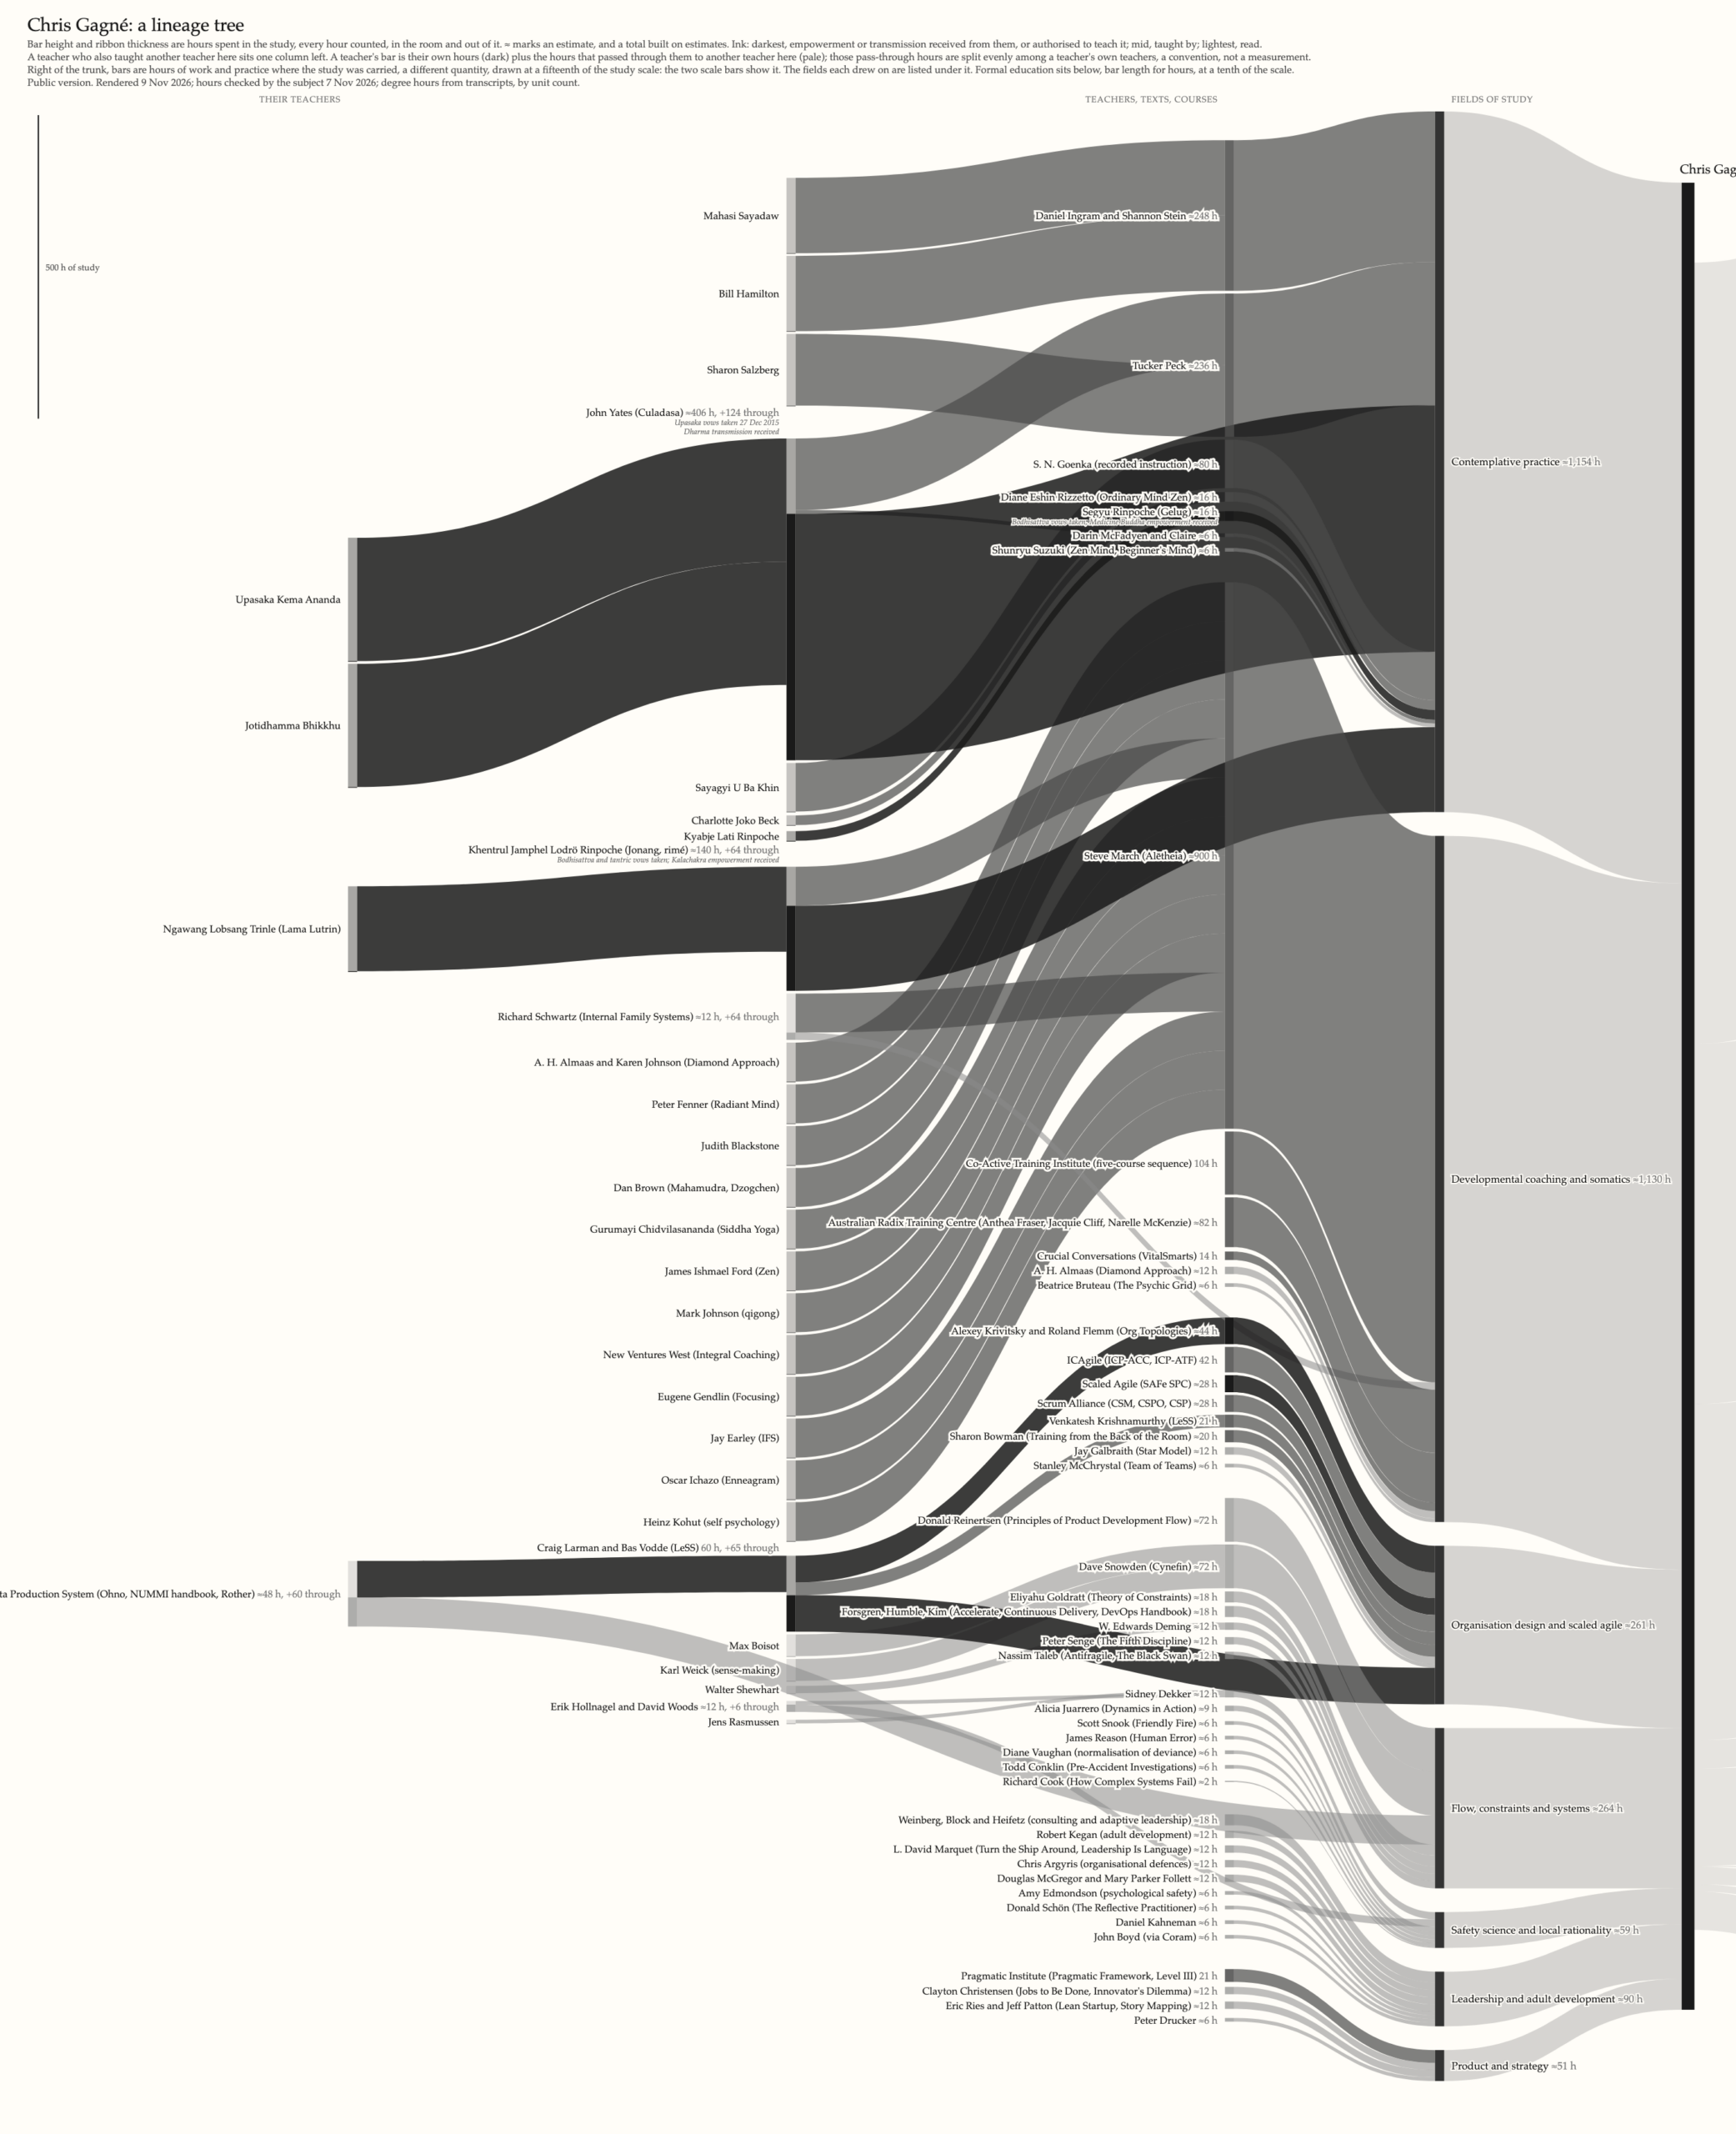
So I had an agent interview me, one evidence category at a time: transcripts, courses, my calendar for the dharma nights I hosted in San Francisco, my client log for the coaching, then the reading, book by book. It drafted a data file with the arithmetic under every number and rendered a Sankey. It was easier for me to audit and correct than to build from scratch.
Width is hours, in the room and out of it. Ink tone is how a teaching reached me: darkest where I received a transmission or was authorised to teach it, mid where a person taught me, lightest where I read it. A teacher who also taught one of my teachers sits a column left.
The numbers
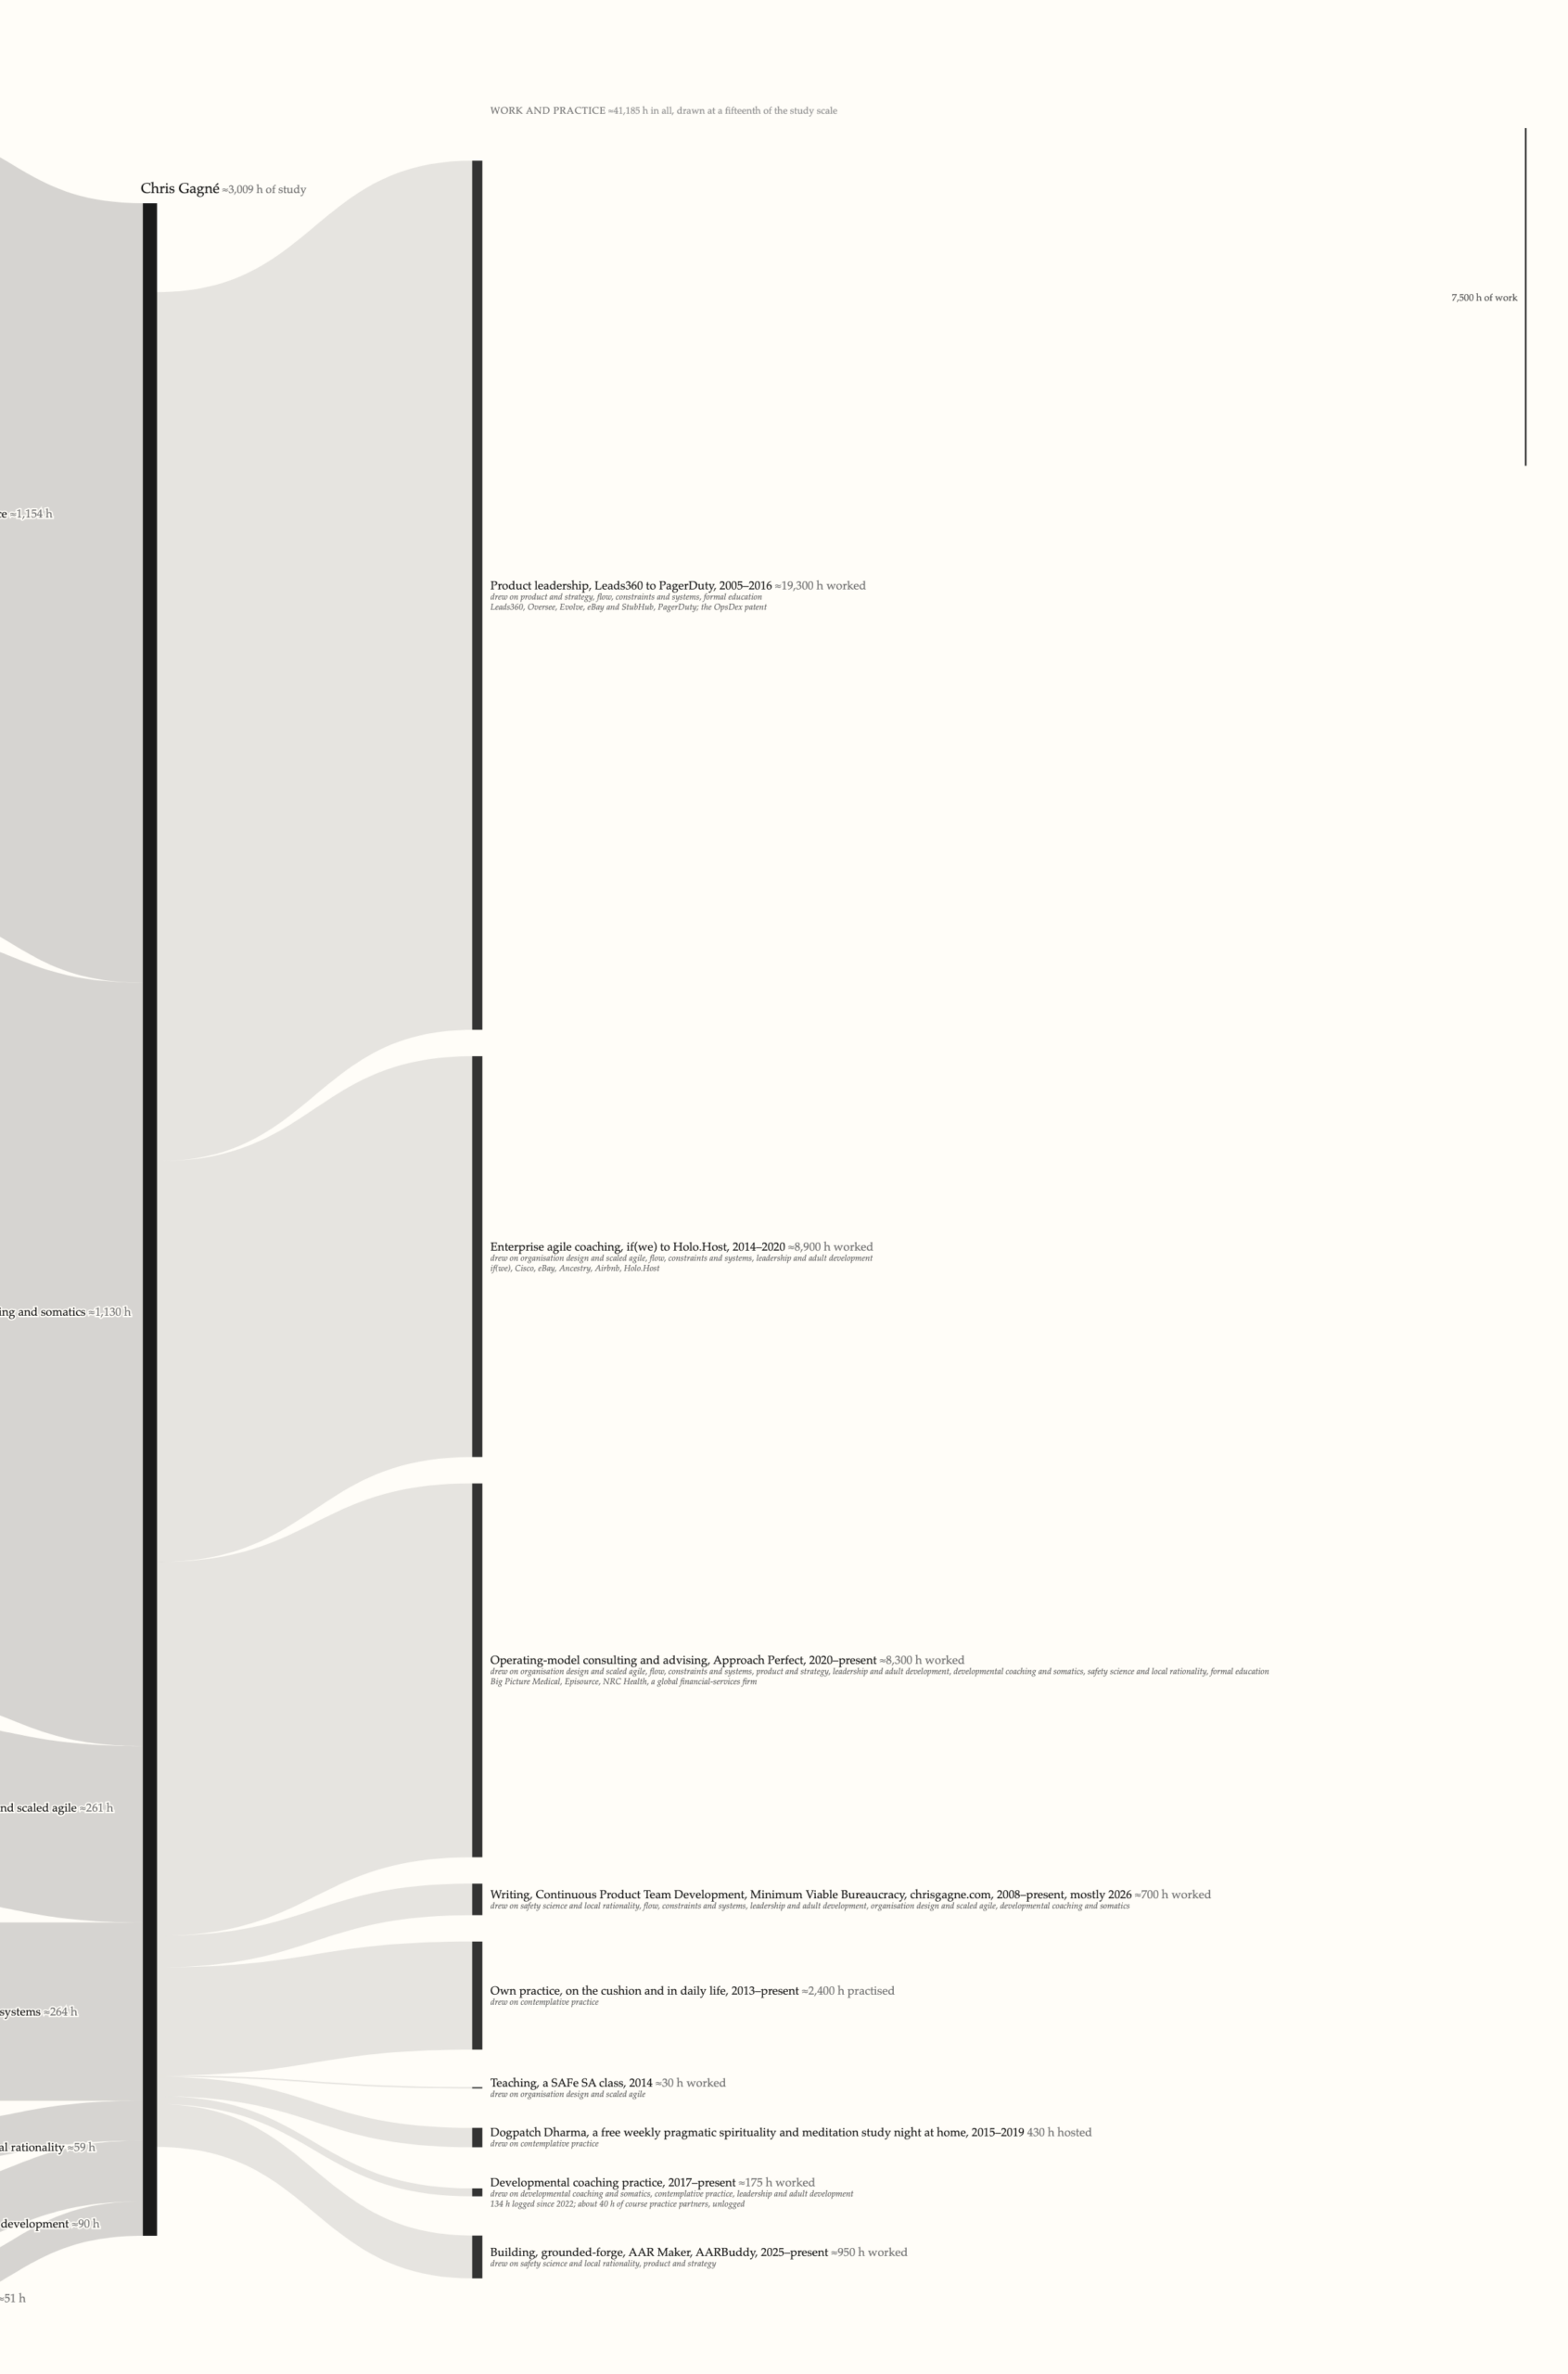
Study comes to about 11,500 hours, 8,490 of them in four degrees and 3,000 with teachers, courses and books. Work comes to about 41,000. The right half is drawn at a fifteenth of the scale, with two scale bars of the same length at the edges so the picture can’t lie about it.
Three-quarters of the hours are in the degrees, and with them in the flow nothing else could be read. A log scale equated a six-hour book with a degree to within a factor of three, and every field came out the same width. The degrees now sit under the chart at a tenth of the scale.
I’ve logged about 175 formal coaching hours, but most of the 1,130 hours of coaching training above it went where I didn’t keep track: into how I mentor, consult and run a room. The chart lists that under the consulting bar and can’t measure it.
The product career ran 19,300 hours on 51 hours of product study plus an MBA. Most of what I know about product came from the job, conferences and colleagues, and none of that is a node: no teacher to name, no record to count. The chart draws what was transmitted and leaves out what was absorbed.
Most of my hours with teachers were in contemplative practice, about 1,150, with Culadasa and Steve March of Alētheia above all. None of it shows in the paid work on the chart, and it’s the ground I do my best work from. It went into about 2,400 hours of my own practice and 430 hours hosting a free pragmatic spirituality and meditation study night at home, about 160 evenings over four years.
If you’d asked me where my learning came from, I’d have named teachers. The hours say transcripts, and the records were on my laptop the whole time. Engineering leaders are doing the same with their teams this year: everyone feels faster with the new tools, nobody took a baseline, and the feeling is the only evidence in the room when the board asks what the spend bought. The records usually exist, and adding them up is the dull part.
Draw your own
The prompt below is what I’d give an agent. The interview takes an afternoon if your records are findable, and correcting the widths takes a few days of odd moments.
Paste this into Claude Code (or any agent that can read files and run Python) in an empty folder. Drop whatever records you have into `evidence/` as you go: transcripts, certificates, a calendar export, a client log, photos of your bookshelves, et cetera. It will ask for them.
Build my lineage tree: a Sankey chart of where my understanding came from and where it went, drawn by the hour.

The idea comes from the Tibetan refuge-tree thangka, which paints a practitioner's teachers and their teachers row on row. Treat it as a map of understanding, not a devotional object. Keep the tone plain and warm, never evaluative of the teachers.

Rules of the chart
- One node per transmission: a person who taught me, a text I read, a course or school where the instructors are unnamed. Group an author's books into one node. Employers are ground, not branches.
- Width is hours spent with the teaching, every hour counted, in the room and out of it. Six hours a book unless I say otherwise. Estimate where you must and mark every estimate with ≈; a total built on estimates carries ≈ too.
- Ink tone is how it reached me: darkest where I received an empowerment or transmission or was authorised to teach it; mid where a person taught me; lightest where I read it.
- A teacher who also taught another of my teachers sits one column left, with the hours split evenly among their own teachers and that split declared a convention, not a measurement. Upstream lineage is a node only when a record names it; otherwise leave it out.
- Group nodes into fields of study, and let the fields flow into one trunk, me.
- Right of the trunk, draw where the study went: employers, engagements, publications, teaching, things built, and my own practice. Each is one bar and one ribbon at its hours worked. Careers run an order of magnitude longer than study, so draw that column at a declared fraction of the study scale and put two scale bars of the same length on the page, one in study hours and one in work hours. Under each bar, list the fields it drew on as a plain yes-or-no list. Never split study hours across activities; no such quantity exists.
- Formal education is transcripts, not transmission. Draw it as a footing strip under the chart at a tenth of the scale, out of the flow, each degree naming where it was carried.
- Two renders from one data file: public and personal. Vows, recognitions, estranged teachers and confidential engagements go in personal notes and stay off the public render unless I say otherwise. Ask me about scope before anything sensitive comes up.
- Greys only, paper background, serif, no legend; a subtitle that says what width, tone and ≈ mean and declares every scale.

How to work
1. Interview me one evidence category at a time: formal education (ask for transcripts), certifications and courses, teacher relationships, texts, employers and places, then where the study went. For each, say what record would settle it, read any I give you, and draft the nodes before moving on.
2. Keep the data in one YAML file with an evidence line and the arithmetic for every hours figure. Write a small Python renderer to SVG and a script to rasterise it. Render after every category and show me; I'll argue with the drawn widths faster than I'll fill in blanks.
3. When I say a number is wrong, ask what record would settle it before changing it. Estimate from a school's published expectations, a calendar or a log before you estimate from my memory.
4. Keep a design-notes file of every choice we tried and rejected, with the reason. Try a square-root and a log scale once, and show me, and record what I chose.
5. When I say it's done, run two cold reviews of the public render: give the image and the SVG to a fresh agent, and if you can, to a second model, with no other context, and ask each what the chart claims and every fault a demanding reader would raise. Fix what holds and record what you declined.
If you’d rather not build the renderer, the same prompt works in a chat: ask for the data file and a Mermaid or plotly Sankey instead of an SVG. You lose the footing and the scale bars, and the hours still tell you something.